


Cuts to Medicaid Would Hurt All Communities, Red and Blue

Republicans in the US House of Representatives are pushing forward a plan to pass a budget that would cut Medicaid benefits, which provide free or low-cost health coverage to people across the country. Medicaid serves roughly 72 million Americans in every state and every locality, and another 7 million people enrolled in the Children’s Health Insurance Program (CHIP), which provides low-cost health coverage to eligible children in families with incomes too high for Medicaid but too low to afford private insurance.
If these benefits were cut, roughly a quarter of Americans would suddenly lose their health care coverage, and it’s likely that health insurance costs would rise for everyone. Cuts to Medicaid spending will also have adverse impacts on health care providers and they services they provide, especially for hospitals that are already financially at-risk.
In a new post on the PolicyViz website, I use Medicaid participation data from Georgetown University and 2024 presidential election results from Tom McGovern, to explore which communities would see the most dramatic effects if Medicaid funding were cut. Crossing the two data sets, I examine concurrent geographic patterns in voting results and Medicaid participation to show how Medicaid cuts will affect different parts of the country, small and large, urban and rural.
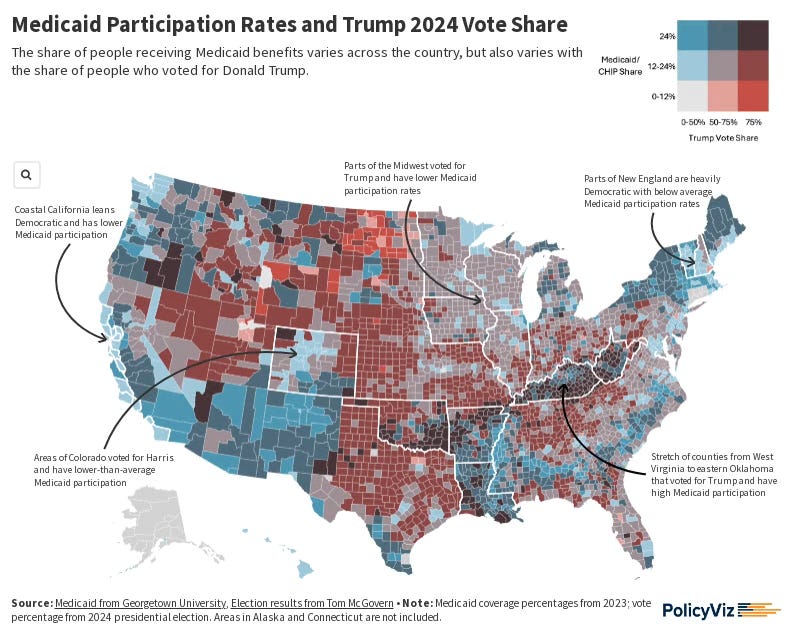
This bivariate choropleth map is the key image and I’ve included an annotated, statc version here. The map shows the share of people who received Medicaid in 2023 and the share that voted for Trump in each county. Several patterns emerge:
There is a streak of counties that heavily voted for Trump and heavily participate in Medicaid in the Appalachia areas of West Virginia and Kentucky, spreading through Arkansas and Louisiana and into eastern Oklahoma. More than 75 percent of voters in these counties supported Trump in 2024 and more than 25 percent of residents receive Medicaid benefits.
Areas of the midwest—particularly, Minnesota, Wisconsin, Iowa, and most of Illinois—are still likely to have voted for Trump but have slightly lower shares of Medicaid participants than the nation as a whole (18.9 percent in Minnesota, 18.7 percent in Wisconsin, 20.9 percent in Iowa, and 19.8 percent in Illinois).
Certain heavily Democratic-leaning areas also have lower Medicaid participation rates. Areas in and around Seattle; Vermont, New Hampshire, and southern Maine; coastal California counties; Colorado between Denver to Telluride; and much of the Washington, DC-New York City corridor were all less likely to vote for Trump and more likely to have Medicaid/CHIP participation rates below the national average.

Source: PolicyViz. See the full interactive version.
Cutting Medicaid (and CHIP) benefits will undoubtedly affect people and families across the country. They will affect people living in deep blue districts and deep red districts, rural and urban areas, coastal states and midwestern states, and everywhere in between.

Data Visualizations
Politics aside, this is a pretty great political cartoon.


Podcast: Engage, Elevate, Communicate: Davina Stanley on Crafting Clear Business Messages
Join me and communication expert Davina Stanley as we talk about the power of clear and structured messaging in business communication. Davina explains how a well-structured message can reduce back-and-forth revisions, build trust, and lead to faster decision-making. Drawing from her diverse career—from teaching kindergarten in Australia to working at McKinsey—Davina emphasizes the importance of outlining, visual hierarchy, and strategic thinking in crafting compelling business messages.
The PolicyViz Podcast was ranked one of the top Data Science Podcasts by Million Podcasts! The longevity and popularity of the show is all due to the listeners, so if you count yourself as a listener, thanks for tuning in!!


Things I’m Reading
Data Visualizations
What is the Financial Risk of Nonprofits Losing Government Grants? from the Urban Institute
In the United States, nonprofits received a total of $267B in government grants. Nonprofits in CA, NY, and DC received the most government funding. Nonprofits in AK, WV, and LA would have the biggest gap to fill if they lost their government grants. Nonprofits in AK, WV, and AR have the highest share of nonprofits at risk of not covering their expenses if they lost their government grants.
Defense Against Dishonest Charts from Flowing Data
If you’re anywhere around dataviz social media, you’ve probably seen this one. If you’re not subscribed to the Flowing Data daily newsletter, I highly recommend it.
TV, Movies, and Music
Interior Chinatown, Hulu
Finished. It was great. I have no idea what happened. Even at the end. Anyone understand this show?
Paradise, Hulu
Yes, yes, yes. Great. Love it.
Zero Day, Netflix
Robert De Niro as a former president investigating a major cyber attack. It’s a mix of political drama, terrorism, and, maybe, dementia? Whole show makes me nervous.
New Lumineers album, Automatic
Still listening to it. Doesn’t have quite the same pop for me as their previous albums. But what do I know? Tickets for their September concert at Nats Park start at, like, $175.
