Elevating Data Visualization: Building and Using Effective Style Guides for Charts and Graphs
Data visualization style guides are distinct from branding guides or style guides in that they (should) clearly and distinctly describe styles for graphs, charts, and diagrams. Branded colors might look great on a billboard or tshirt but they may not work in a chart. Building a useful and effective dataviz style guide can include an array of elements including guidance on color, font, layout, and more.
Over the past couple of years, I’ve been working with Max Graze, Amy Cesal, and Alan Wilson on best practices in developing and using data visualization style guides. We’ve created a huge collection of guides, have conducted surveys and interviews about best practices, and have created our own guides for our workplaces and clients.
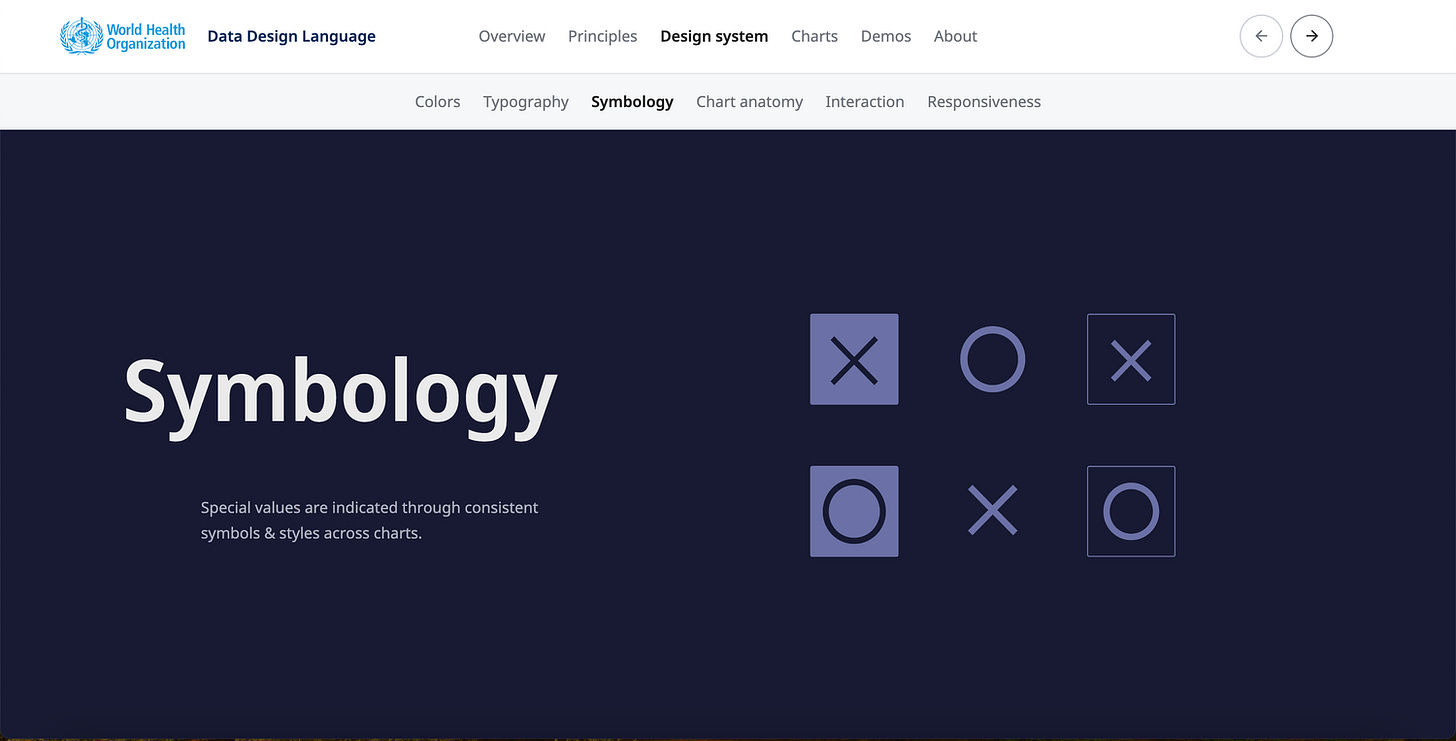
Most recently, we started a short blog series where we each review just one little part of a different guide. We each focus on one aspect of a guide in our collection and highlight why it’s useful and how it can be adapted into other guides. For example, Max wrote up a review of the use of consistent symbols in the World Health Organization’s guide.
I’m also excited to share that a new updated and revised version of the Urban Institute Data Visualization Style Guide was published last week. This guide greatly expands upon the original with new and more guidance on chart types, accessibility, equity, language, and more.
Perhaps most exciting—at least from my side because it’s my project—is the updated graphic style add-in, which is now being released publicly. This new add-in enables users to create a completely styled graph with the click of a single button. And because it’s now released publicly, you can download and customize it for your own styles including colors, font, logo, arrangement, and more. You can read more about the Excel add-in and how to use it on the PolicyViz website.
I’m a big fan of dataviz style guides to lower the bar for everyone at an organization to create consistent and effective charts and graphs. You don’t need to do a ton to get your colleagues on board with good data visualizations, and making it as easy as possible for them to institute good styles can be as simple as a straightforward document, guide, or tool.
Thanks,
Jon
Podcast: Designing with Type: Ellen Lupton on Typography, Inclusivity, and Innovation
I’m so excited to welcome Ellen Lupton to the PolicyViz Podcast! In this week’s episode, we discuss various aspects of typography and design, emphasizing the importance of typography in enhancing content and ensuring inclusivity in design. We also talk about Ellen’s amazing book Extra Bold, which examines women’s underrepresentation in graphic design, incorporating diverse perspectives and examining how personal experiences with wealth affect design choices.
Friends of Flourish Slack Workspace
I am excited to announce the launch Friends of Flourish, a dedicated Slack workspace for the community of creators, collaborators, and Flourish enthusiasts! Whether you're a seasoned pro or just starting out, this space is designed to connect you with like-minded individuals who are passionate about transforming data into stories. Come join the growing community to learn more about how to build great data stories in Flourish.
Things I’m Reading
Books
Pink and Blue: Telling the Boys from the Girls in America by Jo B. Paoletti
The Senses: Design Beyond Vision by Ellen Lupton
Supercommunicators: How to Unlock the Secret Language of Connection by Charles Duhigg
Articles
Highlighting COVID-19 racial disparities can reduce support for safety precautions among White U.S. residents by Skinner-Dorkenoo et al.
Post-growth Human–Computer Interaction by Sharma et al.
Gendered or neutral?: considering the language of HCI by Bradley et al.
The Influence of Personas’ Gender in Design by Lopes & Vogel
TV & Movies
Dark Matter, AppleTV+ (I still don’t understand what happened)
Disclaimer, AppleTV+
Shrinking, AppleTV+
Note: As an Amazon Associate I earn from qualifying purchases.
Supported by: WooCommerce Marketplace
Unlock the full potential of your online business with our cutting-edge WooCommerce plugins. From advanced payment gateways to powerful marketing tools, streamline operations, increase conversions, and enhance the customer experience. Easy to install, fully customizable, and backed by 24/7 support.


