Hi all,
Summer is winding down here in Virginia. We’ve had amazing weather the last few weeks—cool, breezy, and low-humidity—which is really world as most of the US is in terrible heat.
Probably like many parents, the calendar year kind of centers around the school year, which, for my kids, starts in a couple of weeks. That change encourages me to think about what this next “year” will bring. I have a big video dataviz course launching with Skillwave in a few weeks, but the work for that—recording and editing videos, creating templates and step-by-step lessons—is mainly over. (I’ll share more details about the course in the next newsletter.)
The big thing I’ve been thinking about—struggling with, really—is the apparent decline (death?) of the dataviz community on Twitter (or X, whatever you want to call it). Probably like many others, I’m mourning the loss of the active community. I really got my start in data visualization by utilizing Twitter to help me shape my own approach, arguments, and philosophy to communicating data. I used to be able to throw out a question or idea and get dozens of replies spurring really interesting conversations and debates.
I avoided the Twitter cesspool (which does reflect my privilege of not being attacked because of who I love or my skin color) and stayed in my lane of data visualization, economics, and sports. But now, my feed is entirely from large organizations, (unmarked) promoted ads, and even from people I don’t follow (no, Ron Desantis, I’m not donating to your campaign, stop asking). Even though some people have shown how the blue check mark can help you further filter and customize your feed, I’m not inclined to give Elon Musk a dollar nor am I entirely sure it’s a solution—if people in my network are no longer using the service, then I won’t see people anyways!
The question is, then, where to go from here? I’m not going to start using a new social media platform—I’d rather decrease my overall use. I don’t love the experience on LinkedIn; Instagram is fun, but the ability to have conversations is lacking. It’s the discussion, the debate, and the exchanging of ideas that made Twitter so exciting—and useful.
Do I now use it as a one-way street to promote/share my work? Just publish links to blog posts and classes and books, but spend less time there because there are fewer discussions to be had? I’m not sure—and I can’t go to Twitter to ask because no one is there!
Maybe the disintegration of the community on Twitter will enable me to write more and think more. Maybe have more fun outside or exercise. But I miss the community and the conversation.
Thanks,
Jon
PolicyViz at Home 🏡
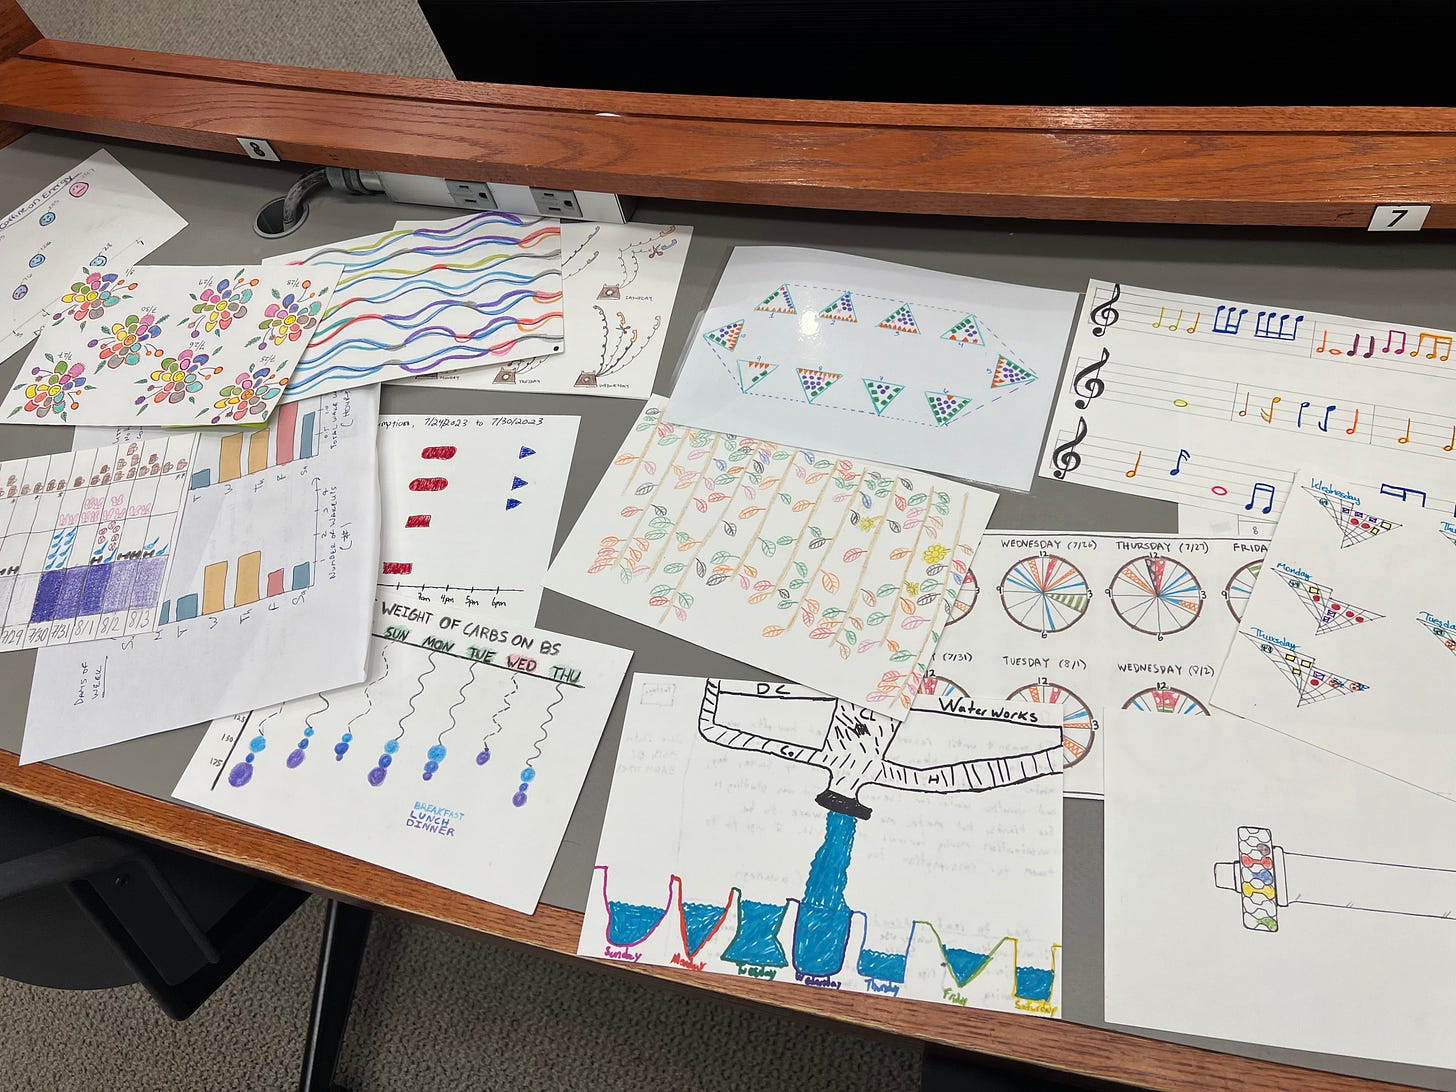
It’s been a lovely summer in Virginia. I’ve been busy teaching my bi-annual data visualization course at Georgetown University the last two weeks. One of the fun assignments students are asked to complete during the class is to create their own Dear Data card. The assignment helps students get away from the computer, explore their own relationship with data (and themselves), and be completely creative. In the last class session, students place their cards on a center table and everyone gets to visit and talk about their work—it’s one of the best parts of the class.
Bringing Joy to Your Data Work with Nigel Holmes
To close out Season 9(!) of the podcast, Nigel Holmes joins me to talk about his fantastic new book now out, Joyful Infographics, I thought this would be the perfect time to have him on the show.
You might notice that I’m making my way through the podcast catalog to update the titles for each episode. I’ve been doing some research and better techniques to attract more readers and one thing I’ve learned is that more active, call-to-action-type titles is better than purely descriptive titles. So I’ll be moving away from the “Episode XXXX: Name Name” style titling to more active titles. I hope you’ll consider listening to more episodes and letting other folks know by leaving ratings or reviews with your favorite podcast provider.
I hope you’ve had a chance to grab a copy of my new book, Data Visualization in Excel: A Guide for Beginners, Intermediates, and Wonks. This is the only book on the market that provides a step-by-step guide to creating better, more effective, and “non-standard” graphs in Microsoft Excel. I have a big favor to ask: Please consider leaving a rating or review on Amazon about the book! It helps more people find the book and make better data visualizations in Excel.
Things I’m Reading & Watching
Books
Sex Is as Sex Does: Governing Transgender Identity by Paisley Currah
Nonbinary: Memoirs of Gender and Identity edited by Micah Rajunov and A. Scott Duane
Articles
Visualization aesthetics bias trust in science, news, and social media by Chujun Lin and Mark Allen Thornton
WordStream Maker: A Lightweight End-to-end Visualization Platform for Qualitative Time-series Data by Nuyen N. Nguyen, Tommy Dang, and Kathleen A. Bowe
The pond-and-duckweed problem: Three experiments on the misperception of exponential growth by Wagenaar and Timmers (1979)
Blog Posts, Twitter Threads, and Videos
The Power of Big Aggregate Numbers from PolicyViz
Querying the Quantification of the Queer: A New Data Structure for Gender Spectra by Fe Simeoni
Data Visualizations
Does SNAP Cover the Cost of a Meal in Your County? from the Urban Institute
Mapping Neighborhoods with the Highest Risk of Housing Instability and Homelessness from the Urban Institute
Burning Hot: 50 Years of Fire Weather Across the United States
How a Vast Demographic Shift Will Reshape the World from the New York Times
What AT&T and Verizon Knew about Toxic Lead Cables from the Wall Street Journal
The grass courts are now in session from Reuters
TV, Movies, and Miscellaneous
Letterkenny, Hulu
Shoresy, Hulu
Note: As an Amazon Associate I earn from qualifying purchases.


I've found myself facing the same dilemma. I'm just mentally/emotionally drained with the social media that I have and I'm not sure I have the energy to rebuild my community on another platform.
The problem? My "brand" is largely because of my presence on Twitter and I'm worried I'll lose that when X goes under.
Hi Jon.
I know you mentioned that you're not going to use a new social media platform but I've seen many Datavizers (is that a word?) on Mastodon and that's where I've seen the most interesting conversations of all the social media platforms I use.
Or, you could use Medium for writting and seeing how the conversations there goes.
Good luck!
(FYI, I'm not using DeadBird anymore...don't find it useful)