


The Implications of Shrinking the Federal Workforce by DOGE’s Recommended 75 Percent

As you surely know, Donald Trump tasked Elon Musk and Vivek Ramaswamy with running the new nongovernmental Department of Government Efficiency (DOGE) to “dismantle Government Bureaucracy, slash excess regulations, cut wasteful expenditures, and restructure Federal Agencies” (Ramaswamy has since left DOGE to run for Governor of Ohio). A few weeks ago, I wrote about the challenges DOGE will have cutting $2 trillion from the nearly $7 trillion federal budget. But what about another idea they’ve floated: cutting the federal workforce by 75%?
To answer this question, I reached out to the Office of Personnel Management (OPM) and the Bureau of Labor Statistics (BLS) to get employment and labor force data for local areas. Turns out that merging those two sets of data were not as easy as I had thought. OPM data were provided at the Core Based Statistical Area (CBSA) level based on definitions from based on definitions set forth in 2023. The BLS data, however, are defined on definitions from 2018 (they’ll be updating to the 2023 definitions soon), so merging the two required not a direct one-to-one match but aggregating county-level data from BLS to match the OPM definitions.
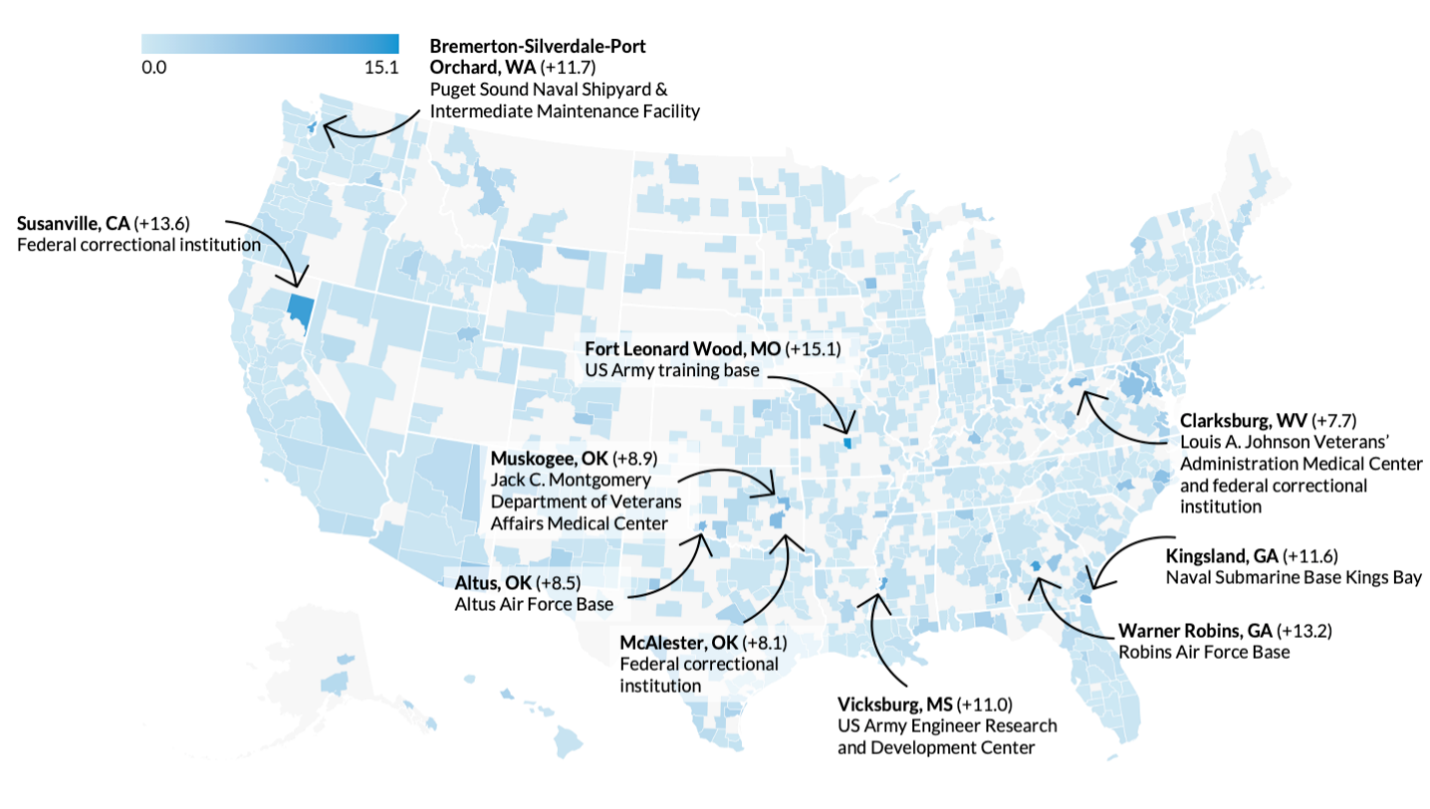
Once I had things matched (plus a separate process for Connecticut), I had 952 distinct CBSA locations for the analysis. I then “fired” 75% of all federal civilian workers and added them to the stock of unemployed workers to calculate a revised unemployment rate. There are a bunch of interesting findings to explore in the data including smaller areas that would be overtly affected by the changes, as you can see in the map below.
If you want to learn more, you can check out the blog post—which includes a set of interactive maps built in Datawrapper stitched together with a dropdown—and a short brief. If you want even more, I’ve put all of the data and my code up on Github, so you can fork and explore.

Podcast: Revolutionizing Web Development: Rich Harris on Svelte's Creation and Impact
Rich Harris, creator of the Svelte framework, stops by the podcast to talk about his work. Rich shares how Svelte originated from his work in newsrooms at The Guardian and The New York Times, where he developed tools for building interactive data visualizations under tight deadlines. We talk about how Svelte simplifies web development by bridging the gap between HTML/CSS knowledge and interactive applications, making it accessible to both experienced and novice developers. Our chat touches on the broader impact of Svelte, including its adoption in diverse applications like DataWrapper and smart TV interfaces.

Saving Federal Data
A number of U.S. government web pages changed or were taken down last Friday as agencies tried to comply with President Donald Trump’s executive orders. One EO declares that the administration will only recognize two genders and another orders an end to all diversity, equity and inclusion initiatives. The impact of both of these is to remove any data that has information on gender or sex beyond the binary, which obviously can affect data that are collected along with those fields. For example, the CDC’s Youth Risk Behavior Surveillance System data have been taken down, which is used to track a range of trends in health, identify at-risk populations, and inform public health policies and programs. There are ways you can help by scraping, saving, and storing datasets that are potentially at risk. Here are some places that you can check out for more details:

Things I’m Reading
Books
Nickel Boys by Colson Whitehead
I heard an interview with Colson Whitehead on NPR and picked up his Pulitzer Prize-winning book. I read Underground Railroad a few years ago and it was amazing.
The Rediscovery of America: Native Peoples and the Unmaking of U.S. History, by Ned Blackhawk
Still working on this one….
Articles
Changes in Nutrient Intake at Retirement by Melvin Stephens Jr. and Desmond Toohey
I’m just interested in this topic as I’ve been doing some research on grocery purchasing decisions (with really cool credit card data) during the pandemic
“Making Data the Drug”: A Pragmatic Pilot Feasibility Randomized Crossover Trial of Data Visualization as an Intervention for Pediatric Chronic Pain, by Beorner et al.
Interesting cross-over between health and dataviz
TV & Movies
Severance, Season 2, Apple TV
Thanks to reader Hana for reminding me of this one! One of the best shows out there!
American Primeval, Netflix
Two episodes in and I’m hooked
You Hurt My Feelings, Netflix
Meh. Sweet ending but only worth your time if there’s no hockey on TV.
