
What is the relationship between trust and beauty in data visualization?
PolicyViz Newsletter #40
Hi all,
I don’t usually write reviews of academic papers in this newsletter. I guess it’s because writing paper reviews can be hard to do—and often boring to read. Also, I’m not sure you, dear reader, are particularly interested in the slow grinding wheels of academia. However, I saw a paper presented at a conference a few weeks ago that, to be honest, bugged me a bit, so I thought I’d use this newsletter space as a kind of cathartic opportunity to discuss it. Don’t worry, I’m not going to get into a gory statistical review, but I do think the paper topic is interesting, so I think this post is worth your time and a little thought.
The paper—Visualization aesthetics bias trust in science, news, and social media from Chujun Lin and Mark Allen Thornton—deals with an important topic: Do people’s trust in data visualizations change or vary based on the aesthetics of the visualization? Especially because of the amount of mis- and disinformation we are exposed to today, the overarching concept of the paper is important: How do we determine whether people trust a visualization? And what can we do, as chart, graph, dashboard, and website designers, facilitate trust with our readers, users, and audiences? Is it just making things look “pretty” or is it something deeper? Something about the data, the visualization type, the text in and around the graph, or the platform being used? Or is it just out of our hands and depends on the person’s individual beliefs and biases?
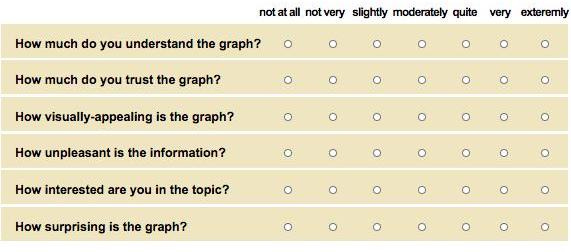
There are six experiments in the paper (don’t worry, I’m not going to describe each one in detail). In the first four experiments, about 300 people on Amazon’s Mechanical Turk were asked to evaluate (on a 1-to-7 scale) 20 graphs across five metrics: beauty, trust, interest, understanding, and surprise. Obviously, how people score each of these is subjective, but is important to the underlying methods.
Graphs were drawn from three primary collections (which you can see in the OSF repository):
Reddit. The paper used the most popular posts in the Data Is Beautiful subreddit from January and February 2021;
Media. Graphs from 11 news sources, including Bloomberg, 538, The Guardian, The New York Times, Washington Post, and others; and
Academia. 310 graphs from 155 scientific publications (2 graphs per paper) from subject areas like neuroscience, physics, ecology, and zoology (no social sciences, as far as I can tell).
What does the paper find? For each of these first four experiments, the paper reports that “participants’ trust in graphs was associated with how beautiful participants thought the graphs looked.” Now, that sentence seems correct to me: self-reported scores of beauty and self-reported scores of trust are correlated. But the rest of the paper takes it a step further to argue that there is a causal relationship—that beauty causes readers to trust graphs more. And that’s where I started to get bothered because the paper does not measure whether self-reported trust is associated with any behavioral change. And, importantly, is self-reported trust the same as actual trust?
Another underlying problem is that there isn’t a direct test of comprehension. If you made a totally incomprehensible beautiful abstract piece of art, this paper would suggest it is somehow trustworthy. If you don't contextualize aesthetic measurements with some objective measure of performance, there's little ability to interpret the results.
There’s an additional, fundamental methodological problem, particularly with the experiment that used the Reddit graphs. The paper states that “in all studies, we presented graphs with minimal contextual information—at most the titles and abstracts of scientific articles.” But this is not true. Many of the graphs in the Reddit sample include source and data notes, author names, or logos (see below as an example, which you can get from the OSF repository).

I would absolutely perceive a graph that includes those attributions and sources as more trustworthy and reliable than one that did not (assuming, you know, I have a positive perception of the creator). From my perspective, this is a fatal flaw of the paper. An alternative strategy would be to delete all source and attribution notes or, even more generally, start by creating original graphs rather than using graphs found in the real world. In this way, the experiment could better control for the various factors and focus on specific graph attributes.
One other thing on the other two experiments. In these experiments, graphs were manipulated to create a beautiful version and a less beautiful version “based on beauty-related visual features” such as color, style, and resolution. The less beautiful version of graph pairs has low resolution, small font size, Comic Sans font, and desaturated color.
What does a “more beautiful” graph look like, you ask? Take a look: The graph on the top is “less beautiful” and the one on the bottom is “more beautiful.” Whatever results you were to get from people’s perceptions of the graph, do you think it would suggest there is a causal link between beauty and trust?


I don’t claim to be an expert in the visualization research field (I don’t even claim to be an expert in the economics research field!), but when we read experiments like this that make broad claims—especially causal claims—it’s worth digging in a little deeper. The intersection of trust and data visualization is hugely important and while I appreciate the paper taking a step to better understand those mechanisms, I’m not sure this paper has generated such insights.
Thanks,
Jon

I hope you’ve had a chance to grab a copy of my new book, Data Visualization in Excel: A Guide for Beginners, Intermediates, and Wonks. This is the only book on the market that provides a step-by-step guide to creating better, more effective, and “non-standard” graphs in Microsoft Excel.
Please consider leaving a rating or review on Amazon about the book! It helps more people find the book and make better data visualizations in Excel.
PolicyViz at Home 🏡
School is back! Both kids are now in high school, which is very cool, but also terrifying. My daughter is a junior in high school, so we’ve started the process of thinking about college. We’ve also visited a few—we spent a fun couple of days in Pittsburgh visiting Pitt and Carnegie Mellon. Many more schools to come, I’m sure.
Season #10 of the PolicyViz Podcast coming soon
I’m gearing up for the Season #10 premier of the PolicyViz Podcast. I have a ton of great guests lined up and am excited for guests to help you learn how to create better and more effective graphs, charts, and more. This is the time to catch up on the last 243 episodes before new ones come out!
Things I’m Reading & Watching
Books
Sex Is as Sex Does: Governing Transgender Identity by Paisley Currah
Legibility: How and why typography affects ease of reading by Mary C. Dyson
Articles
Visualization aesthetics bias trust in science, news, and social media by Chujun Lin and Mark Allen Thornton
Rainbow Colormaps Are Not All Bad from Colin Ware, Maureen Stone, and Danielle Albers Szafir
Visualization for Villainy by Andrew McNutt, Lilian Huang, and Kathryn Koenig
Blog Posts, Twitter Threads, and Videos
The Power of Big Aggregate Numbers from PolicyViz
Querying the Quantification of the Queer: A New Data Structure for Gender Spectra by Fe Simeoni
Beyond Numbers: How Ethical Data Visualization Tells the Human Story by Soha Elghany
Data Visualizations
Trump asks to push Jan. 6 trial beyond 2024 election — to April 2026 - Washington Post
Rising Temperatures Are Wreaking Havoc Year-Round - Bloomberg
Visualizing State and Territory CCDF Policies as of October 1, 2021 - Urban Institute
Excess Mortality and Years of Potential Life Lost Among the Black Population in the US, 1999-2020 - JAMA
TV, Movies, and Miscellaneous
Letterkenny, Hulu
Barbie
Gran Turismo (this weekend, maybe?)
Note: As an Amazon Associate I earn from qualifying purchases.
In practice, I don't know how to determine if a graph is "beautiful" or not; this sounds subjective to me. But there are certainly well-established UI/UX design principles that indicate best practices for communicating information, and the graphs that you describe as "beautiful" are those that conform to these best practices. In particular, the graphs of the Belgium agribusiness lobbying follow this pattern: for instance, it's hard to read the text and captions of the "non-beautiful" graph on Belgian agribusiness lobbying, while the "beautiful" graph is easier to comprehend. So I'm not so sure that it's helpful to frame this in terms of aesthetics, but I find it very plausible that people tend to trust information that is communicated more effectively.
By the way, I ordered your Excel book from Amazon, and I look forward to learning from it!